Data Driven Empowerment
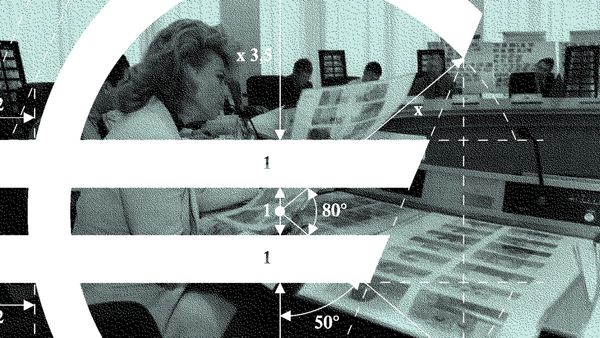
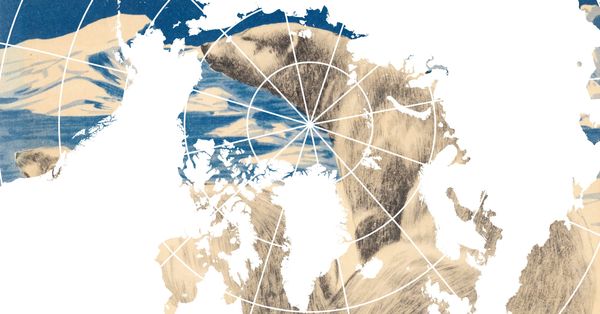
In our practice at Visual Intelligence, Data Driven Empowerment describes an approach to using data and visual representation to support autonomous knowledge production, collective visibility, and political agency.

Data
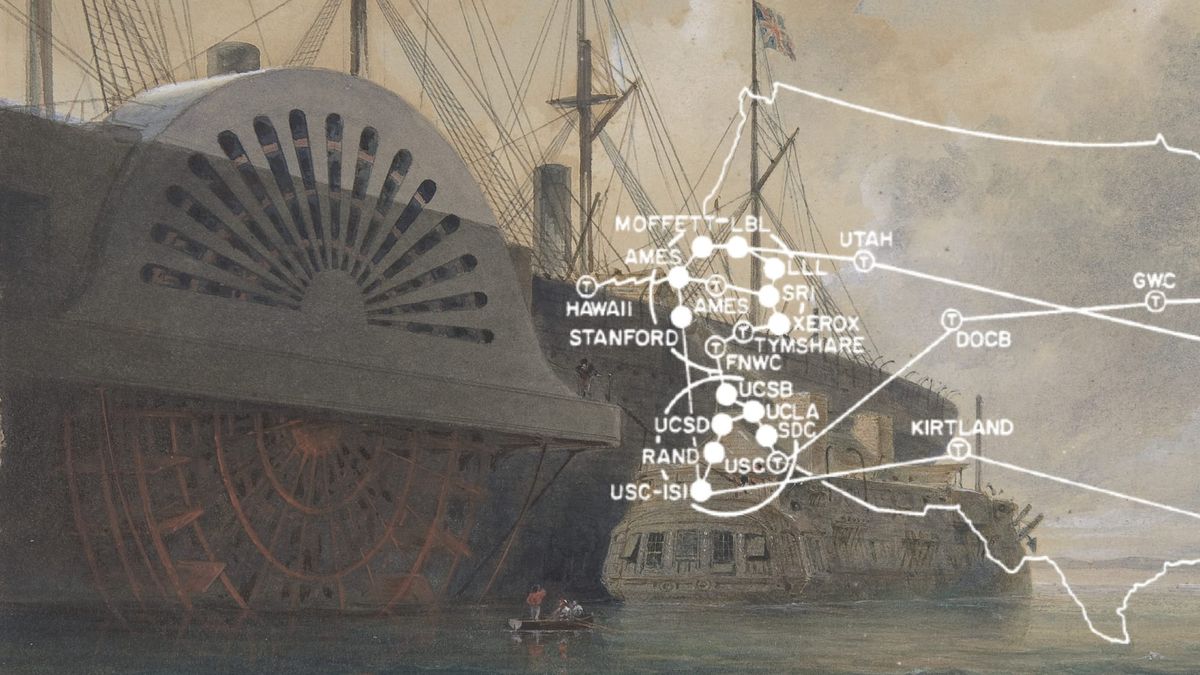
“What hath God wrought?”, people wondered when those very words were transferred from Washington to Baltimore via a wire as Morse code. The question bridged the sixty kilometres faster than horses, pigeons, or any other known means of transport at that time.
Quite a lot, one might answer when looking back at this event 182 years later. Although it was not so much God, but rather Samuel Morse who laid one of the foundation stones of our interconnected, data-driven world with his technology. Without the means of transferring information almost in real time, of replicating and connecting it with other information, data would not be the economic and political resource they are today. If it took ten days to get tomorrow’s weather report, ten hours before a data broker could use my clicks for advertising purposes, or five hours for Palantir to link data from an array of databases and transfer it to an ICE officer in Minneapolis, data would not be “the new oil”, to quote the mathematician Clive Humby who already coined this phrase in 2006.
Two hundred years later, we’re still not done with the God metaphors. Our data are not on servers interconnected via undersea cables; they are on the Cloud. So, once again, close to God – at least figuratively.
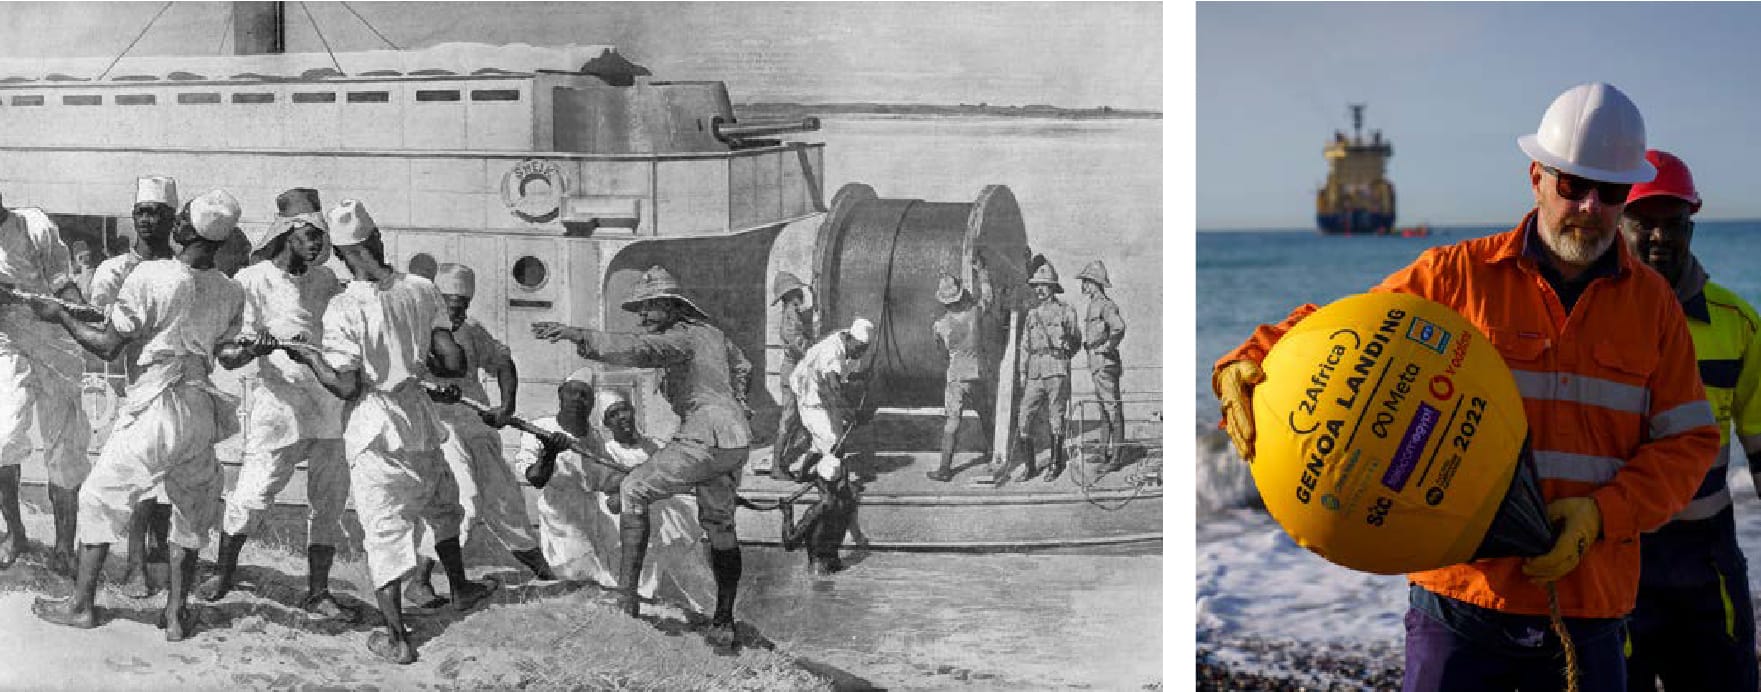
The cloud however is in fact a remarkably mundane place, given that it is made up of datacentres, fibre optic cables, cooling systems, and power plants with enormous energy demands. It has owners and employees. And a geography, even though its interfaces are designed to keep it as secret as possible. This geography is part of geopolitical realities. Where data are stored and via which lines they circulate determines who can access them, whose laws govern them, who controls and monitors them, and who can shut them down. Hence the cloud is not only hiding its geography but also its political dependencies.
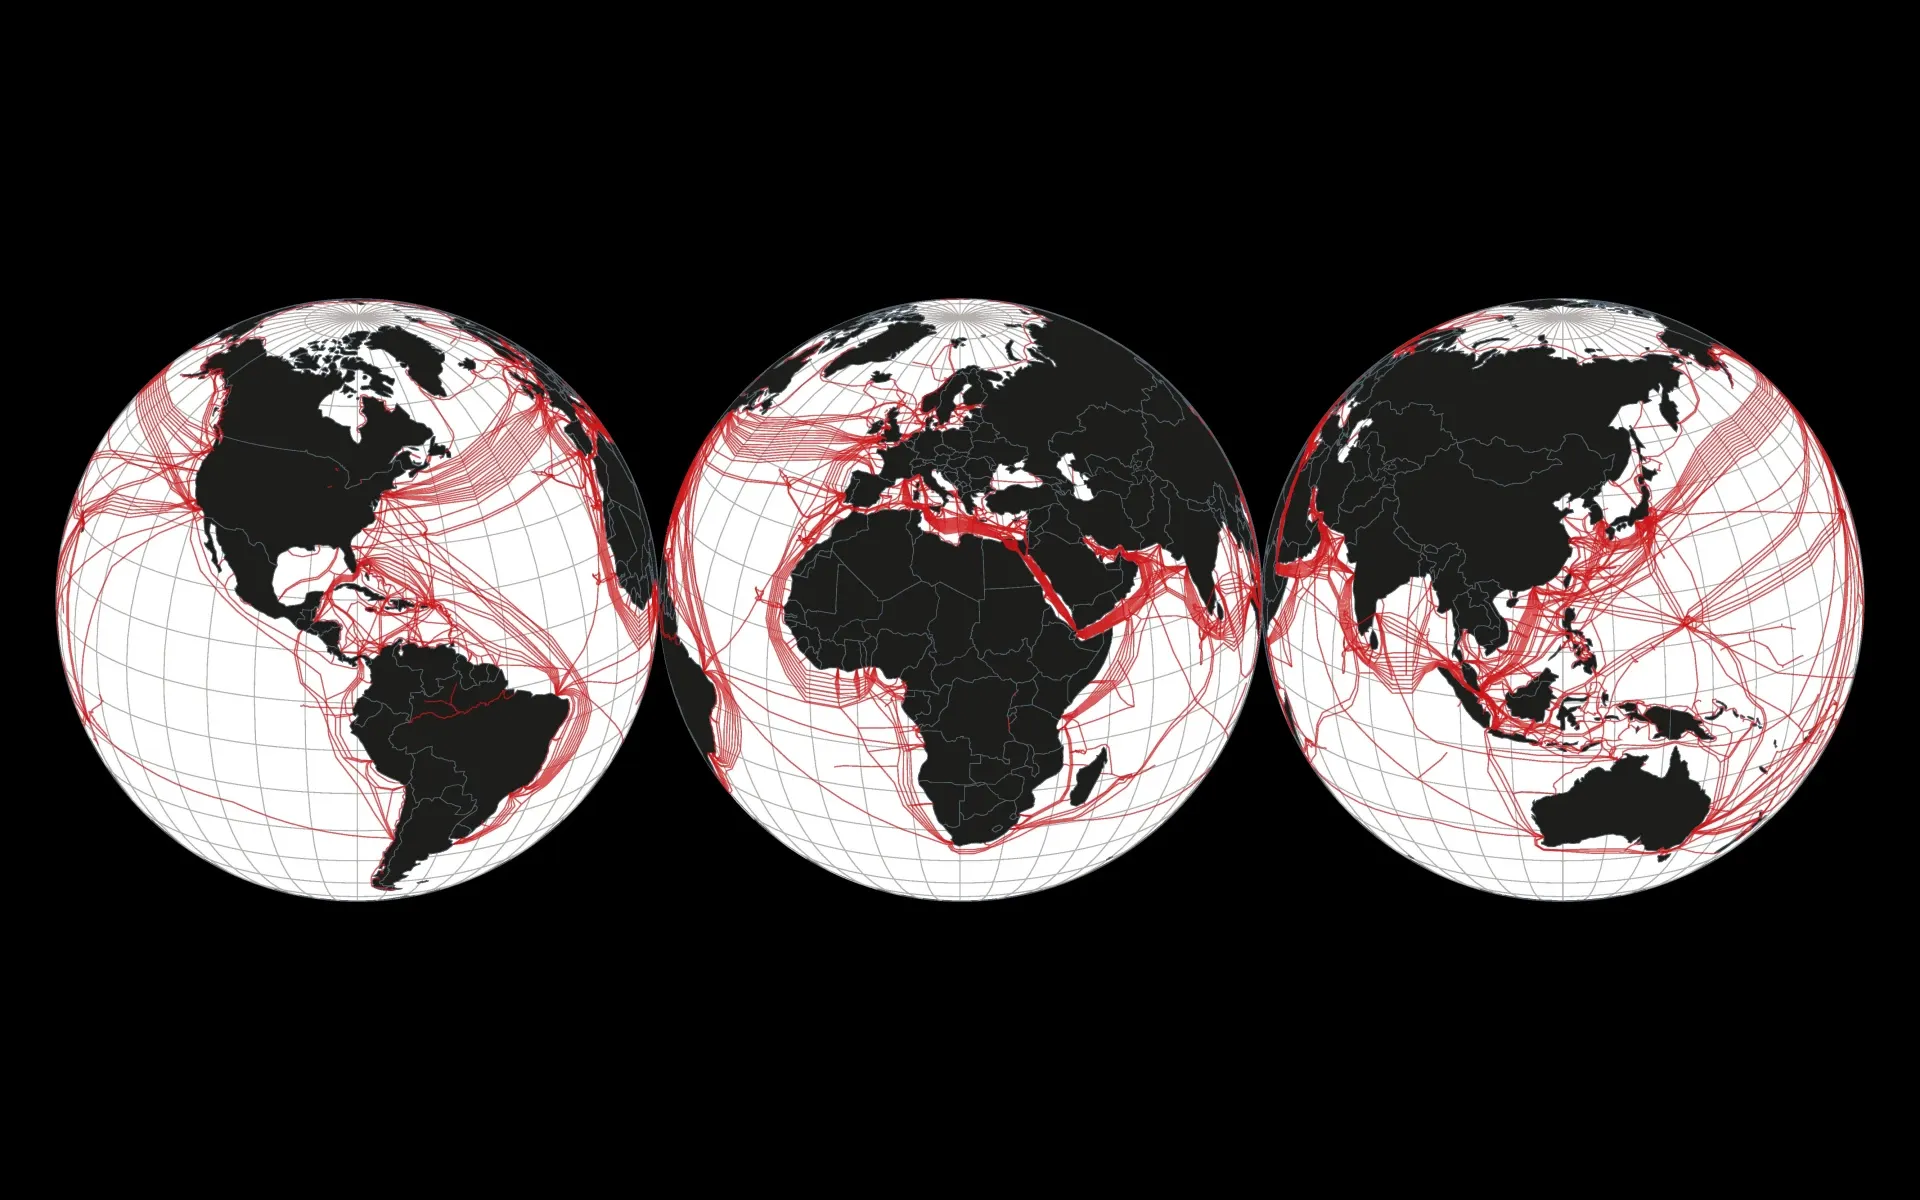
At the same time, single enterprises are increasingly taking over both the transport and the processing of data. Google, for example, is the sole owner of the Equiano cable that runs along the West African coast, while Meta owns part of the 2Africa cable system. Big tech companies control the whole chain from the undersea cables to the datacentres to the images on our screens.
Visual Representation
Data are valuable. However, as Humby implied with his metaphor, unprocessed data are about as useful as raw oil. They need to be selected, connected, assessed, in a word, processed. The result is a usable form that renders the unprocessed data human readable. This process obfuscates their material infrastructure, thereby conjuring the illusion of a seemingly understandable, palpable world. This is where the power of visual representation comes in.
A visualisation does not simply show everything contained in the data. It evolves through creative operations involving questions such as: Which categories are relevant? Which distinctions should be highlighted? Which connections should be made visible? Or which section, which scale, and which perspective should be chosen? What should be reduced, ordered, weighted, named or omitted? What seems like a neutral representation is the result of numerous subjective decisions.
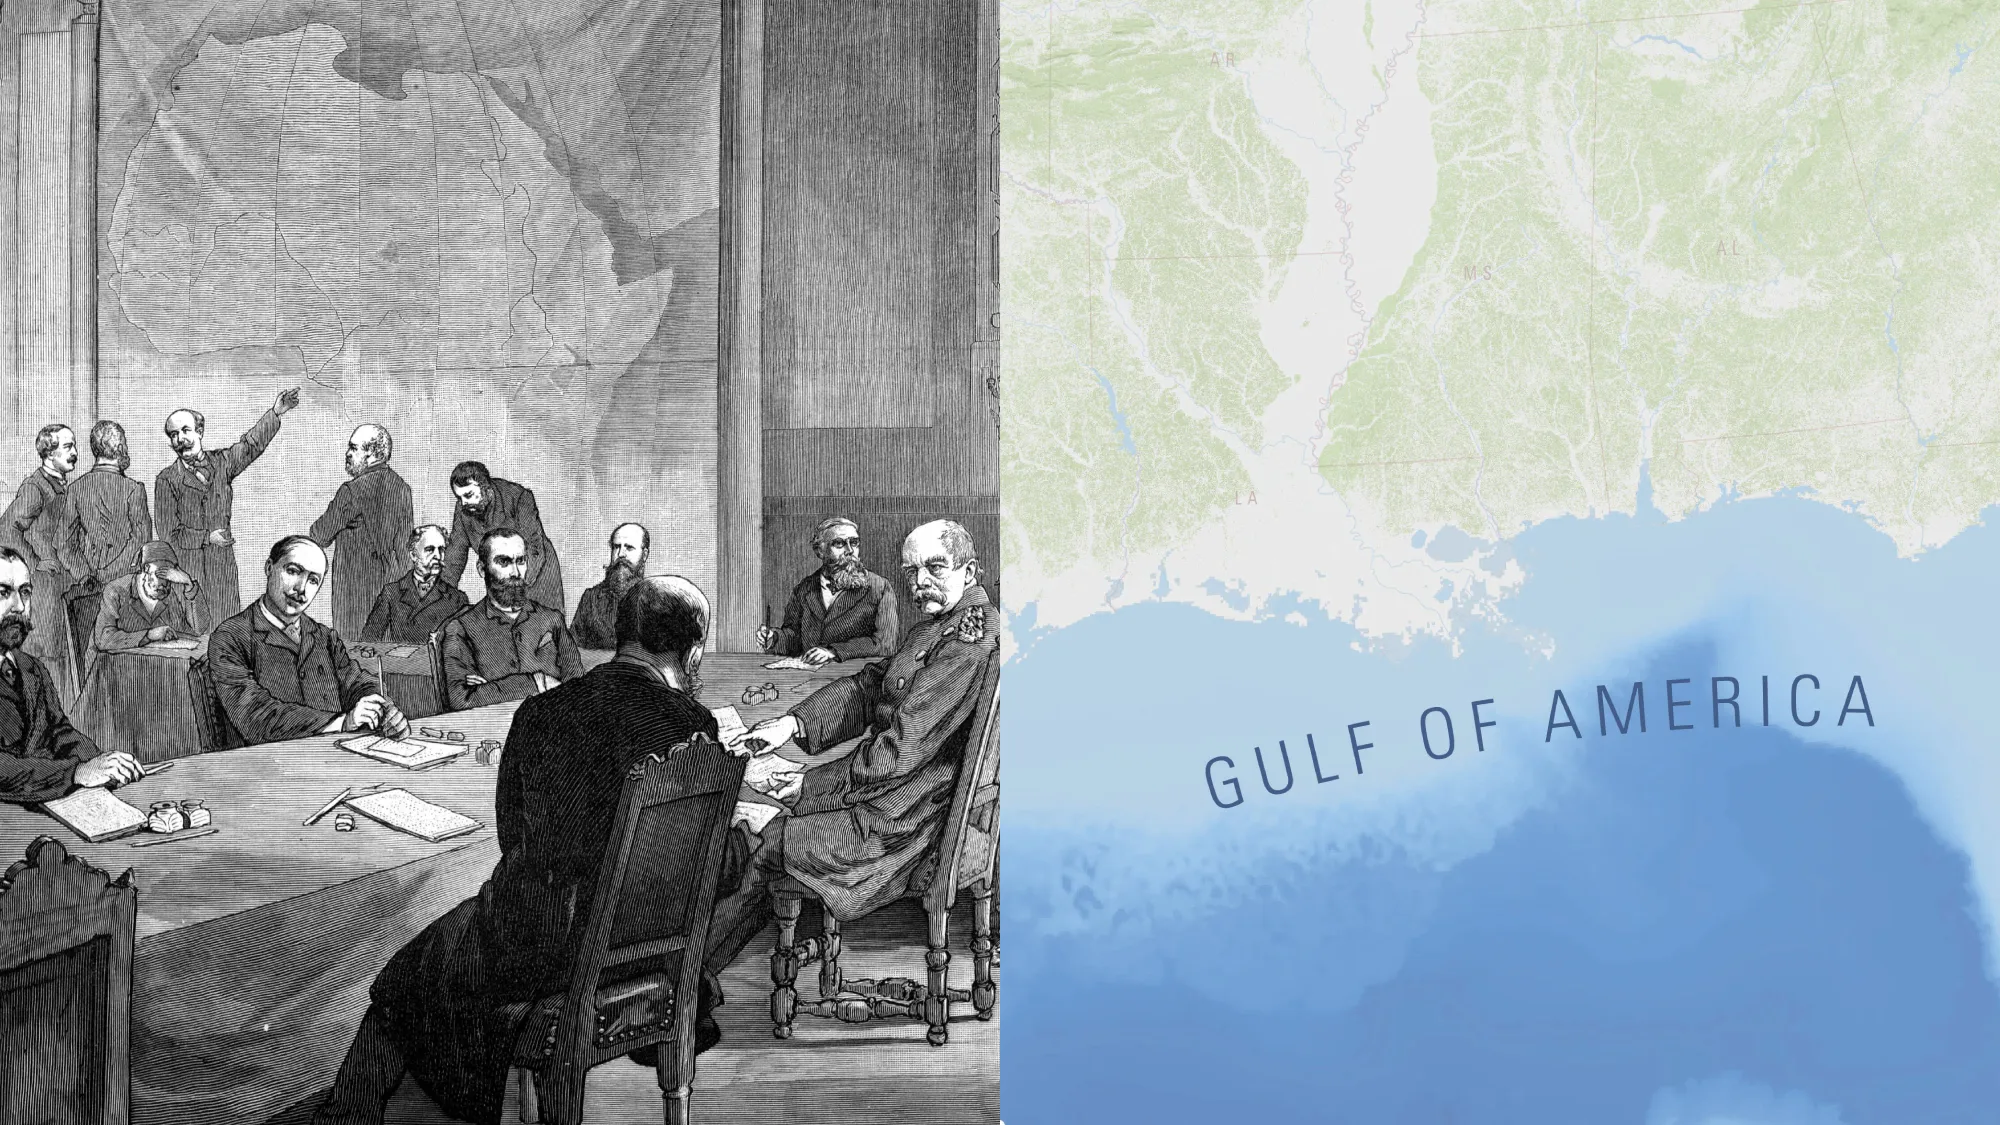
Almost no visual tool demonstrates this ambiguity as clearly as cartography. Maps are among the most complex artefacts: They merge writing, planes, shapes, colours, and symbols in a visual system designed to render our multilayered world readable and manageable. What started out as an elusive complex of connections, movements, and territorial ideas, can now be measured, allotted, and divided. Hence cartography does not simply represent reality. Like other visual representations, it is a tool that codetermines what seems familiar and what seems foreign, which categories to define, where to draw borders, and which perspectives – or realities – to establish as natural. Visual representations thus produce reality.
Data and Visual Representation
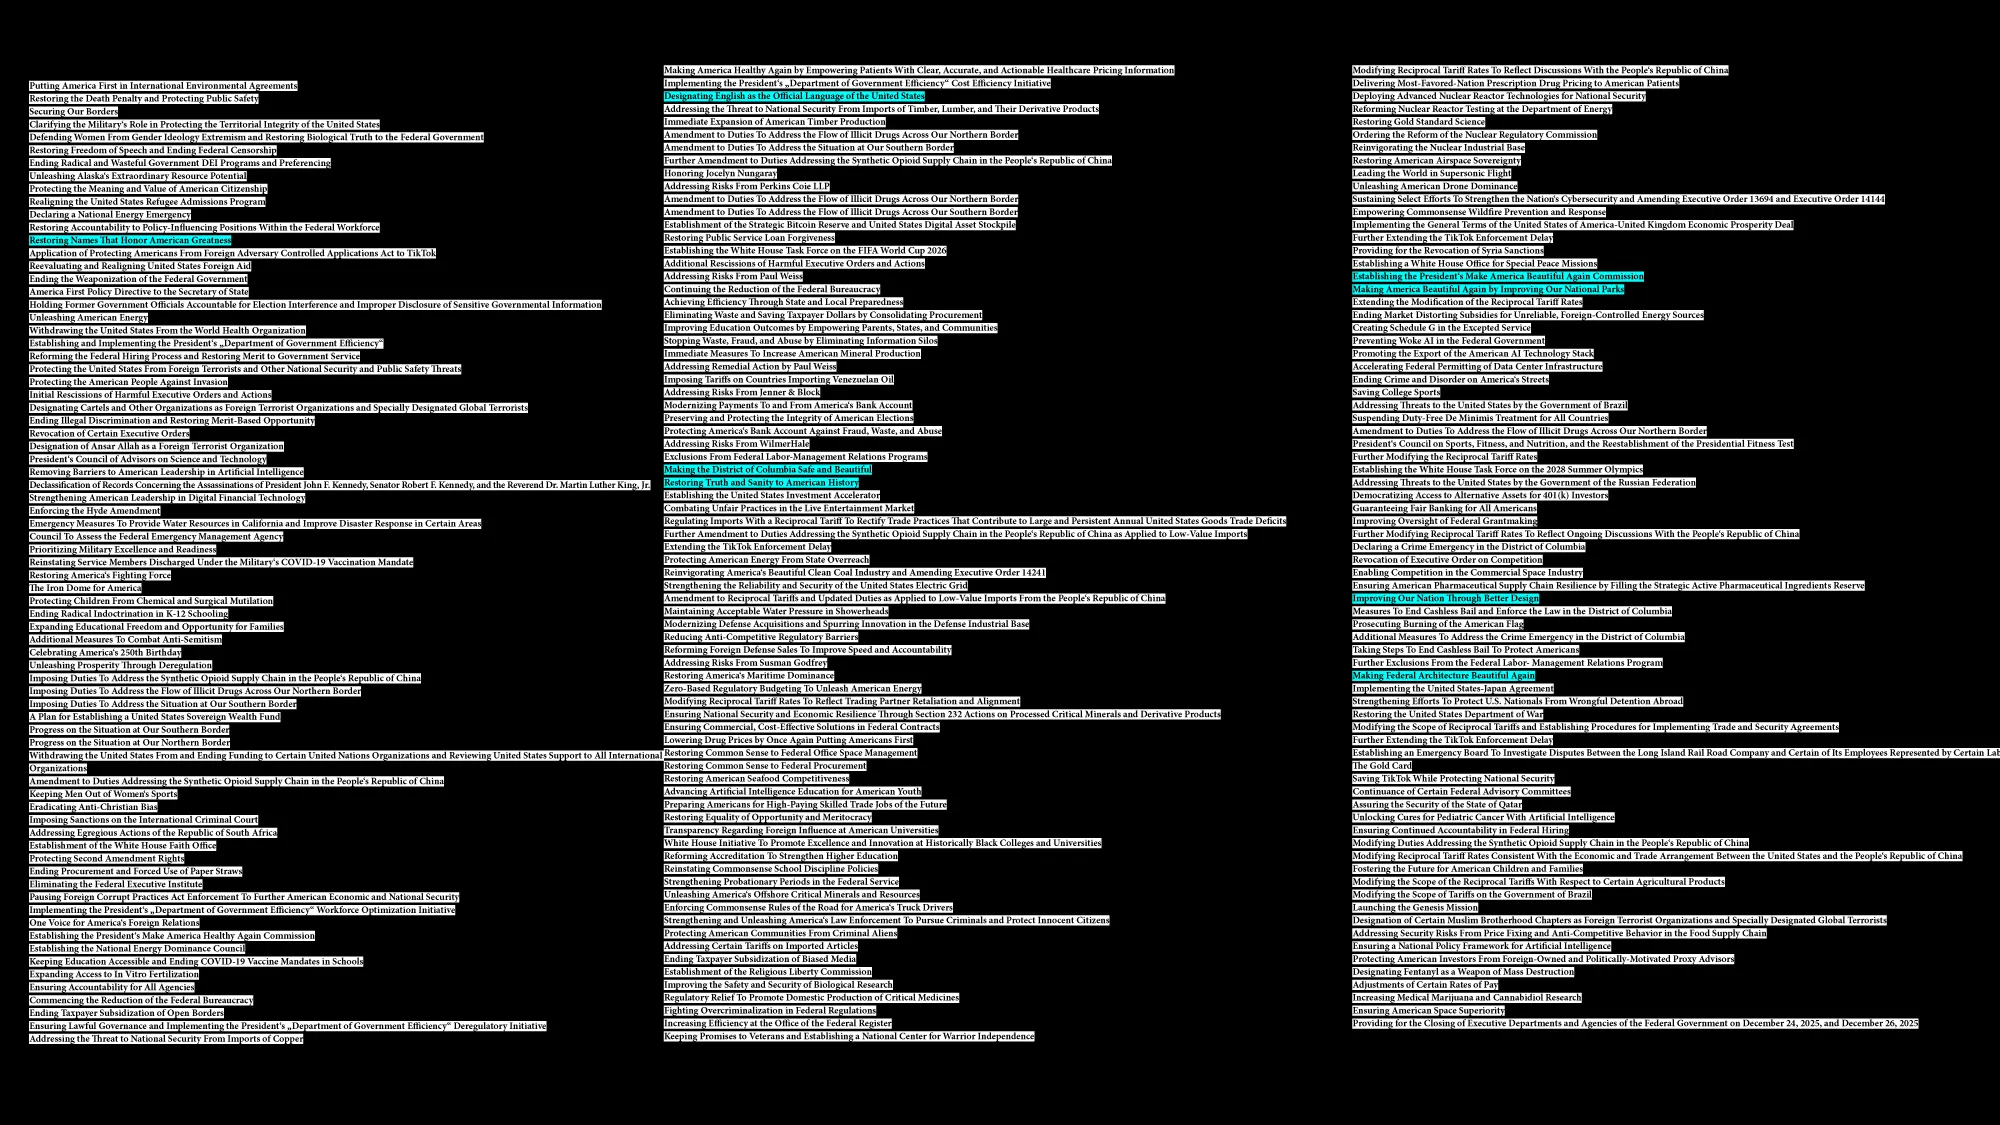
The more our society is organised through data-driven platformization, automatization, and algorithmic decision-making, the more important visual interfaces become. Visual representation is gaining social and political significance as a cultural technique and is used accordingly by a range of actors. One example: Only one-and-half years ago, Donald Trump dominated the headlines for months with his plan to rename the Gulf of Mexico as the “Gulf of America”. Overall, his executive orders manifest a remarkable preoccupation with geographical names, public websites, architecture, monuments, and historical representations. Design, it seems, is not a decorative addition to politics, but rather one of its tools – applied top-down.
Data Driven Empowerment
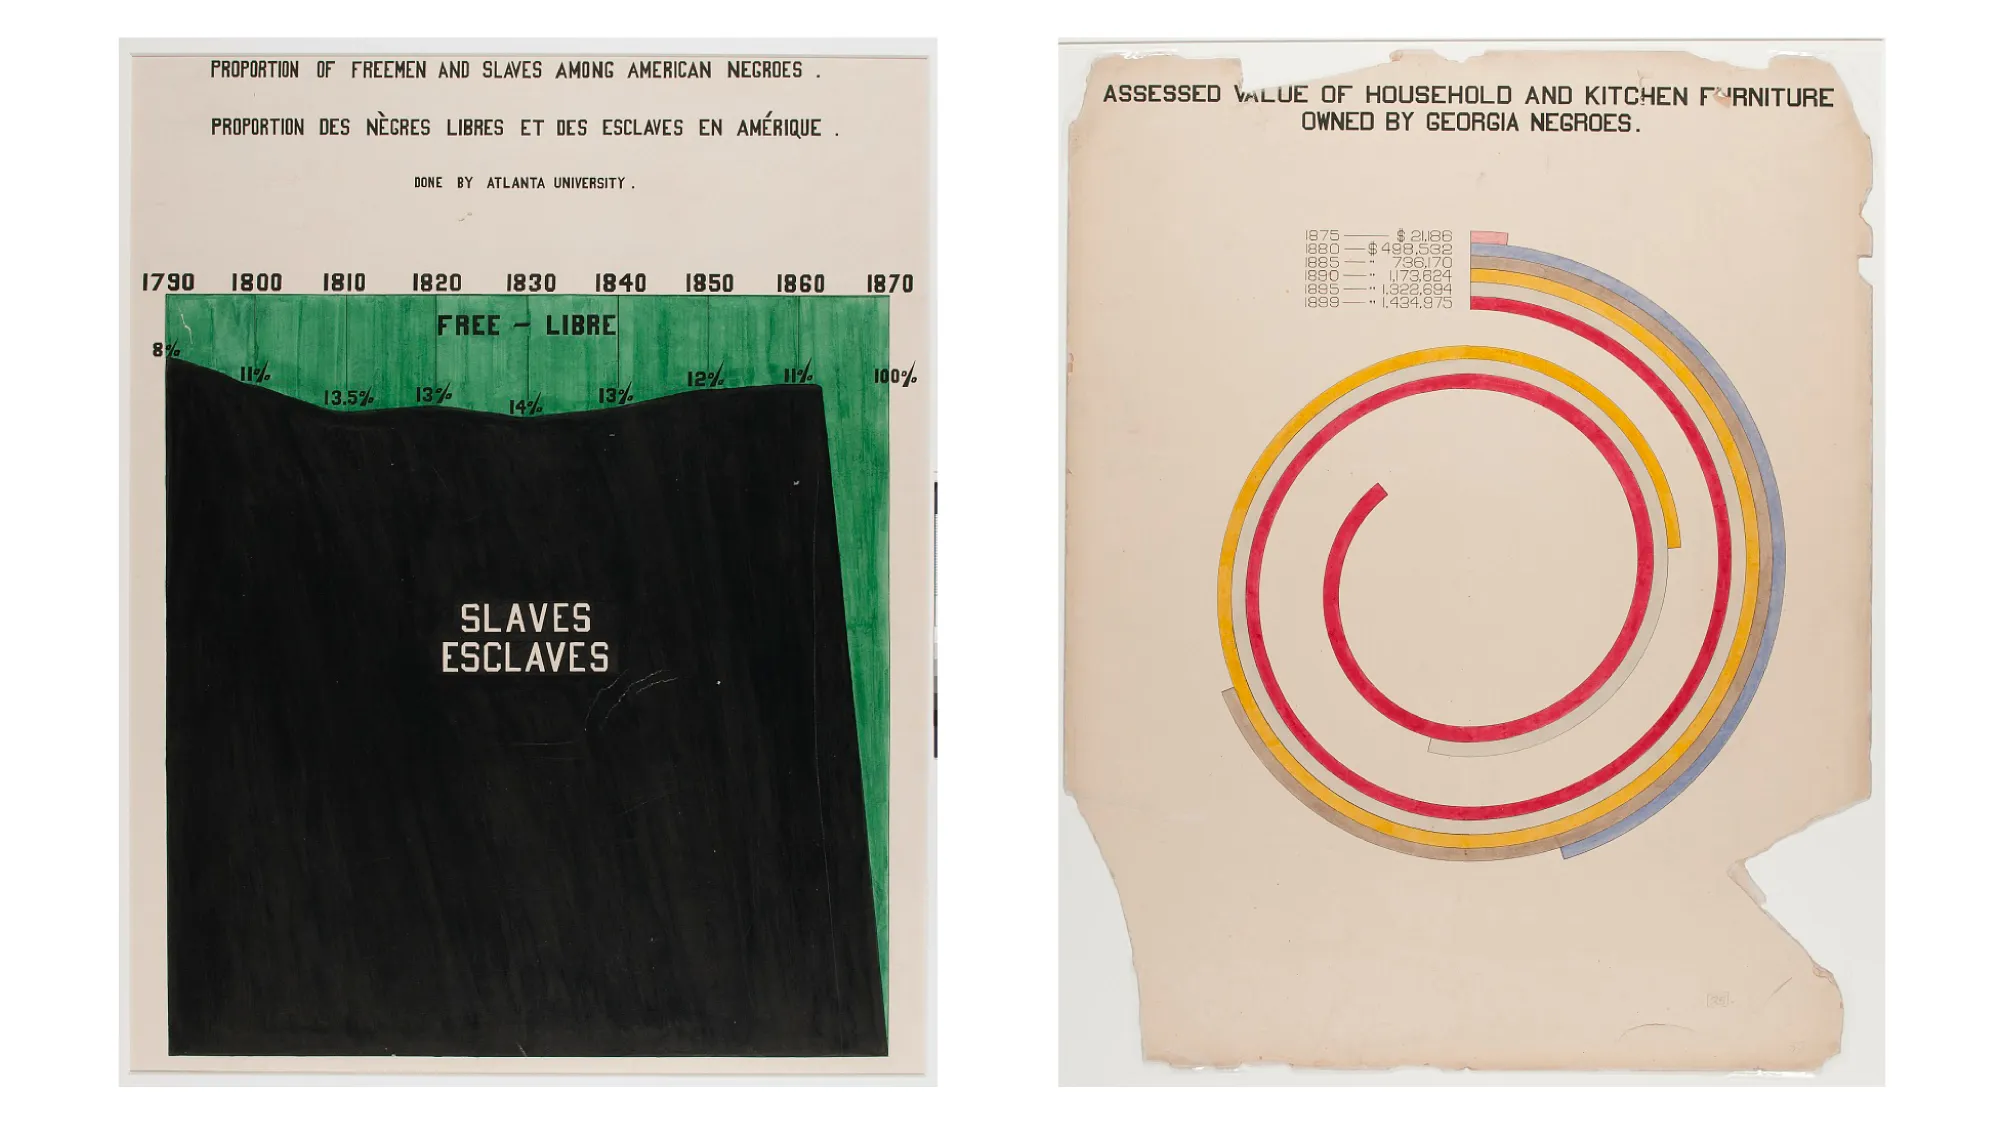
As these are precisely the contexts in which we operate as designers, we developed a bottom-up approach in our creative practice at visual intelligence called Data Driven Empowerment. The idea is to perceive data and visual representation as a means of self-organising in a civil society, autonomous knowledge production, and political agency. The American historian and sociologist W.E.B. Du Bois’ conceptual work is an important reference for this approach. For the Paris World’s Fair of 1900, he and his team developed a counter-public to the racist and stereotypical representations of the time by pairing hand-painted data visualisations with photographic portraits. While the diagrams provided statistics on education, work, property, and demographic development to illustrate the lives of Black people in the United States, the portraits showed the individuals behind the datapoints. This combined approach yielded a counter-representation to outside views of Black reality by showing it from within.
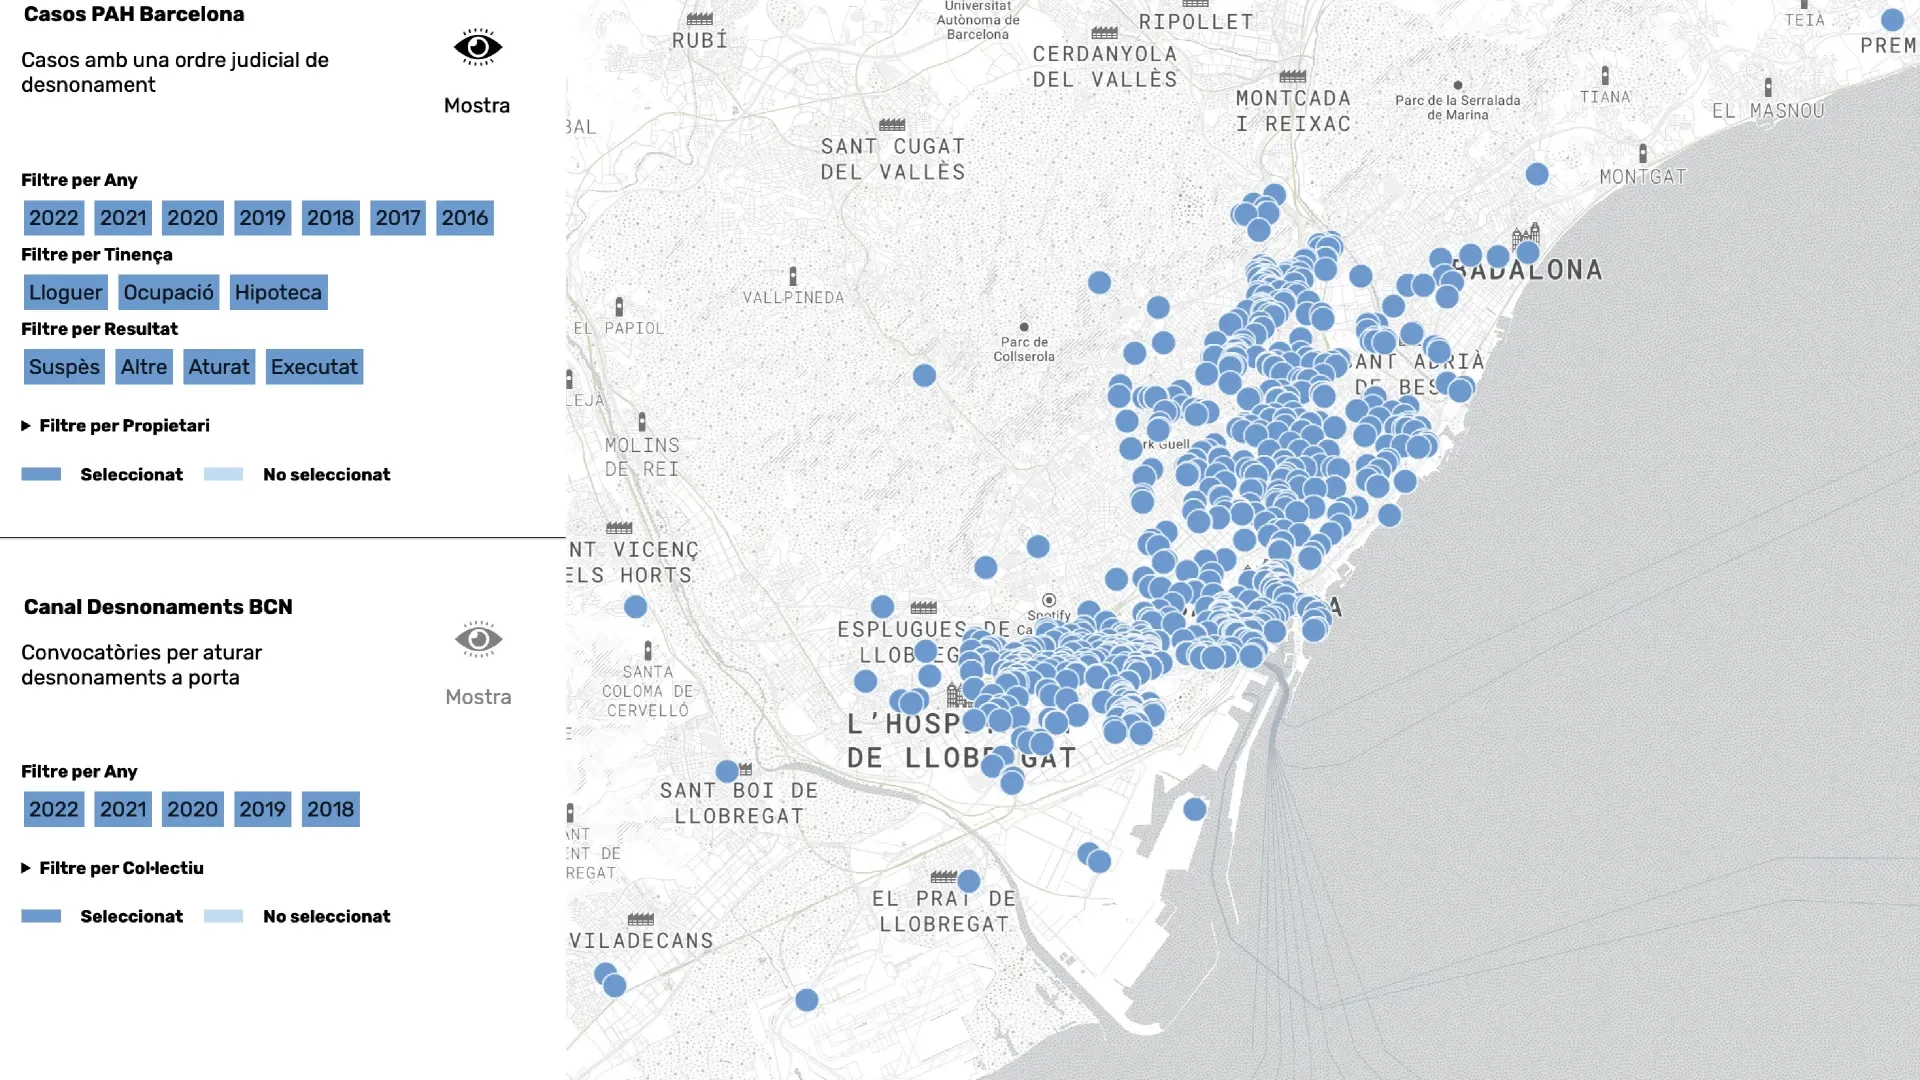
Data are often distributed across archives, institutional databases, or local registers. Thusly separated, their effectiveness is limited, which is why our creative work usually begins with the establishment of a consolidated data structure. For this purpose, we collect information, define categories and relations, determine locations, and link individual entries – often with the subsequent visualisation in mind. For a project on the documentation of evictions in Barcelona, we thus established a communal database to gather reports that had been circulating in Messenger groups for protest organisation. The full extent of the evictions only became apparent once we visualised all these cases on one map, which showed that the seemingly unconnected, singular events were in fact part of a geographically traceable institutional pattern. It revealed which districts had the most cases, which owners were involved repeatedly, and who the instigators were. Likewise, the number of successful protests and prevented evictions became evident. By merging the work of local civil society initiatives, the map visualised their collective political impact.
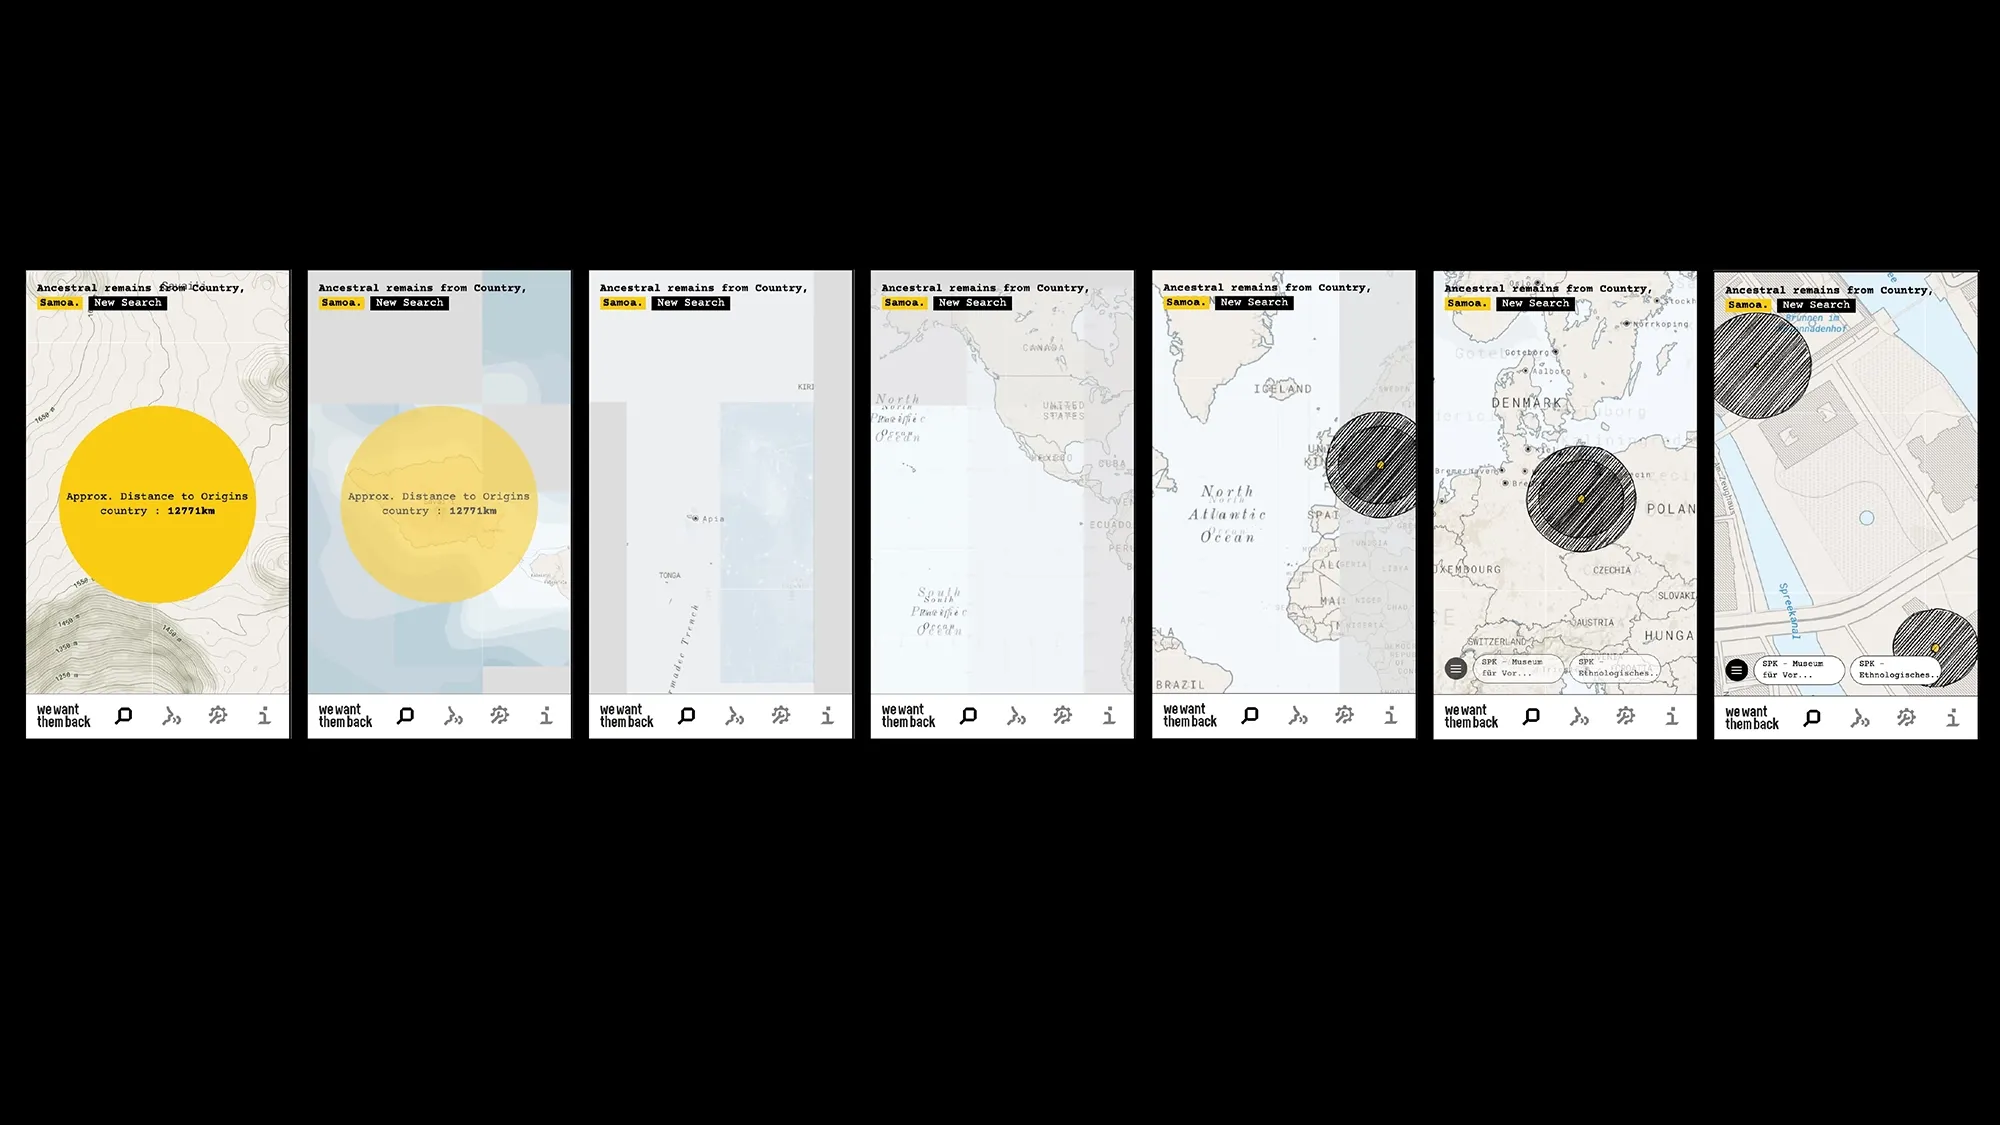
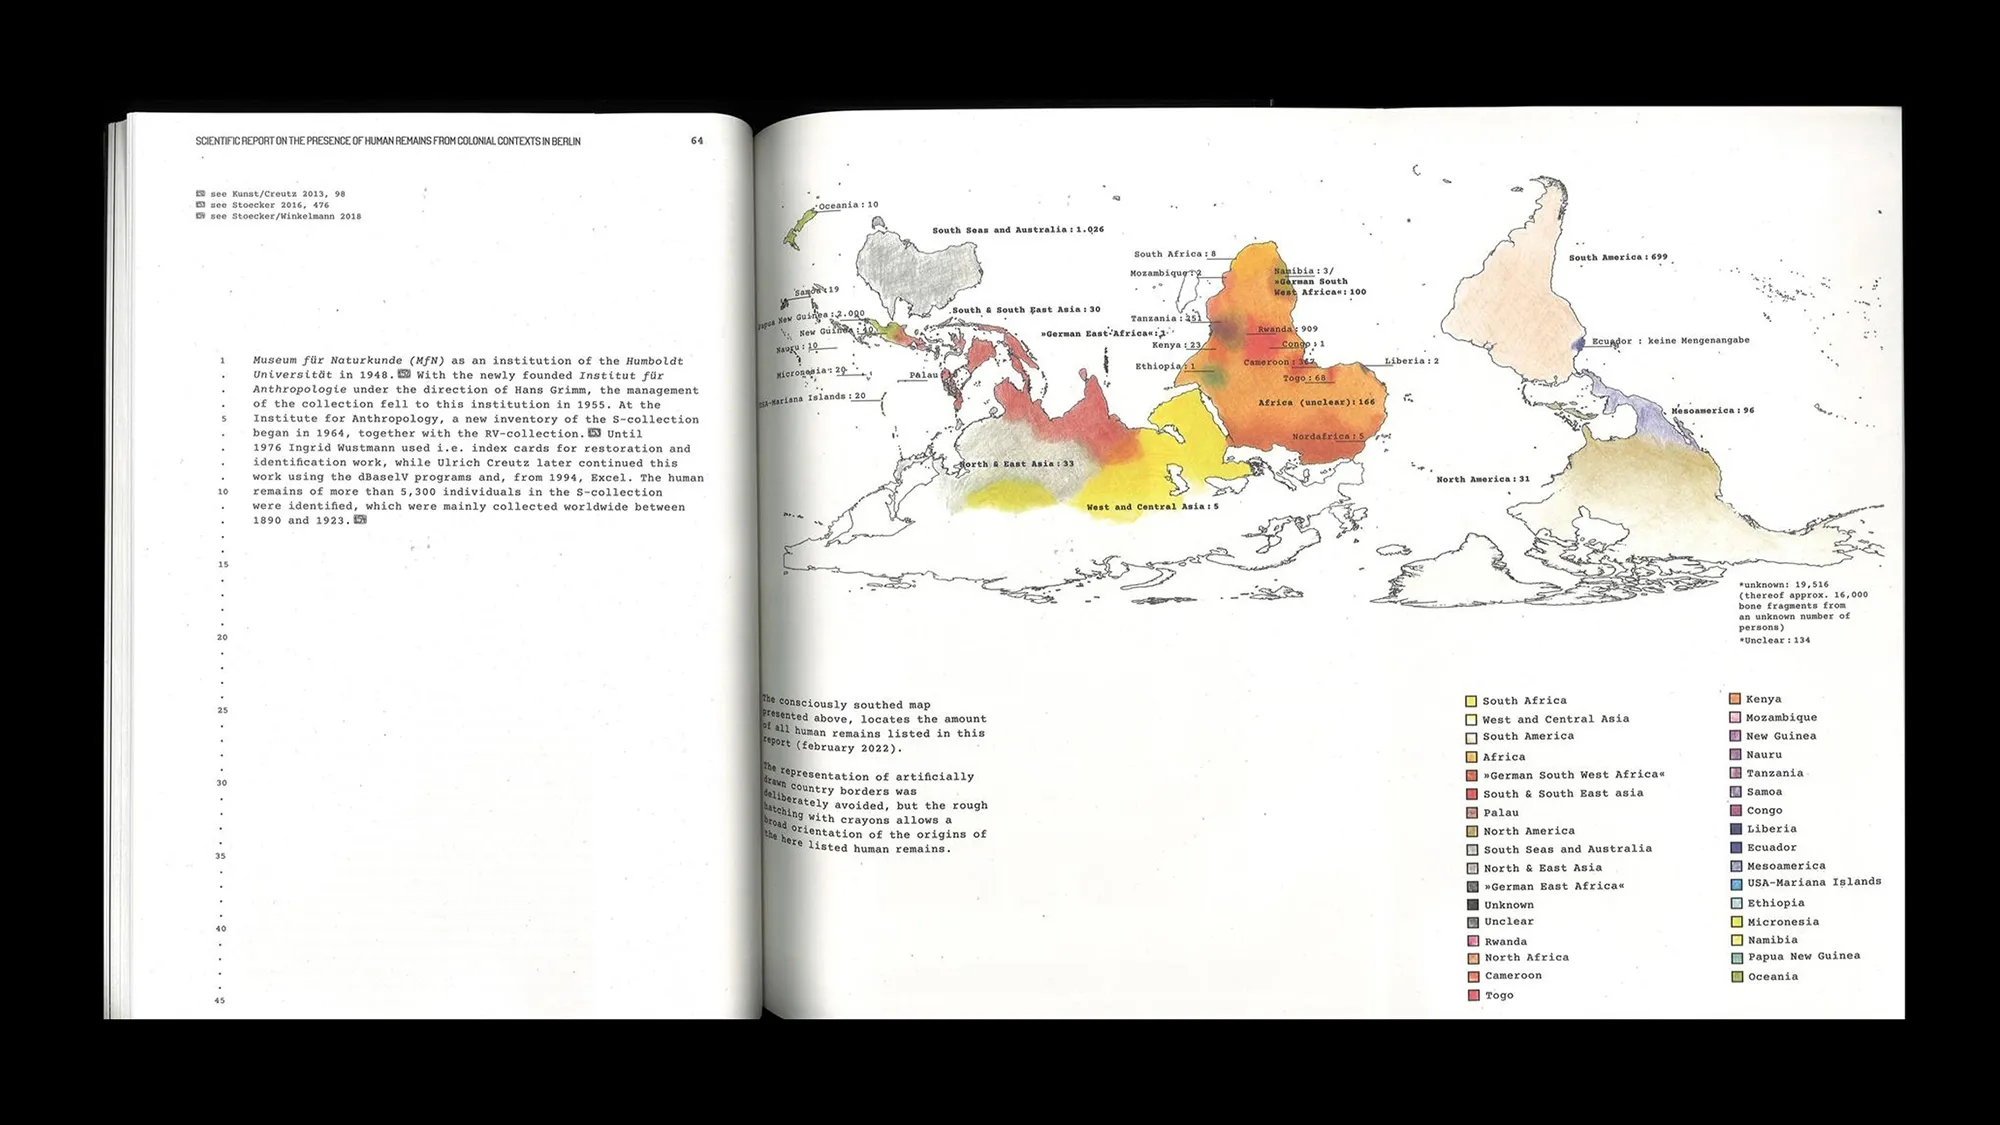
In another project we developed a digital application to compile information on ancestral remains from colonial contexts we found in the collections of German museums and universities. The datasets still existed, but due to their distribution across various archives, inventories, and in- stitutional databases, they were hard to access for descendants and origin communities. The app reorganises this information from the descendants’ perspective by using search filters such as region, country, or continent. When an entry is opened, the map moves from the place of origin to the German institution in which their ancestors’ remains can be found today. This virtual movement across thousands of kilometres manifests the absurd distance and links two sites that are commonly treated as separate in institutional databases. Data uncertainties or ambiguities, as well as multiperspectivity and gaps often serve as important conceptual material in our practice, which is why we manually visualised some of the data in the accompanying publication. Rather than attempting to correct imprecisions, the hand-drawn lines and planes leave room for uncertainty, contradictions, and different perspectives, thereby adding a human perspective to the data structure, in which ancestral remains are often reduced to numbers, inventory entries, or collectibles.
Data Driven Empowerment is not a complete model but an ongoing process: By establishing and visualising autonomous civil data structures, we hope to produce a counter-public that generates visibility and effectiveness. Our work often involves infrastructural questions: Where can we host? Which server can we use? Which software? Who has access to the data? Certain dependencies are unavoidable. Ultimately, autonomous databases are also on the cloud, and thus, linked to that same global infrastructure via servers, cables, and platforms. We must continue to find and create new spheres of action within these conditions.
This essay first appeared in the Booklet: On Display – How Graphic Design Shapes Us. Edited by Jonas Deuter and Matthias Wagner K. Museum Angewandte Kunst, Frankfurt, 2026. Proofreading and English translation by Katherine Lewald.
Fig 1: eigenes Werk / own work
Fig 2: The Graphic Published Saturday, 10 September 1898. Image © Illustrated London News Group. Image created courtesy of The British Library Board
Fig 3: 2Africa-Presskit / 2Africa-Presskit
Fig 4: Über Land und Meer. Allgemeine Illustrierte Zeitung, Jg. 27 (Oktober 1884–1885), Bd. 53, Nr. 14, 308)
Fig 5: U.S. Geological Survey
Fig 6: eigenes Werk / own work
Fig 7: Library of Congress Prints and Photographs Division Washington, D.C., LOT 11931, no. 51 (M) [P&P]
Fig 8: Library of Congress Prints and Photographs Division Washington, D.C. , LOT 11931, no. 25 [P&P]
Fig 9: own work
Fig 10: own work
Fig 11: own work